Back to Blog
- Introducing the Cyberbit Readiness Dashboard
- Measure, demonstrate, and improve operational readiness in real time
- Measuring readiness means enabling business
Security teams are expected to be ready. But how do you prove they actually are?
For too long, SOC managers and CISOs have been stuck using proxies — certifications, attendance records, isolated tabletop drills — to demonstrate readiness. The problem is that those don’t reflect how teams perform when a real attack hits.
The Cyberbit team is here to change that.
Introducing the Cyberbit Readiness Dashboard
Security leaders are under growing pressure to measure and report on operational readiness, not just effort. Until now, that’s been nearly impossible. The Readiness Dashboard connects performance to business impact with clear, actionable metrics that matter, giving you what no one else does: a real-time, executive-level view of how your SOC team performs in actual live-fire cyber exercises.
Not theory. Not guesswork. Just real data from real scenarios, delivered in one clean, centralized dashboard.
Measure, demonstrate, and improve operational readiness in real time
Let me see if I can guess the real issues every security leader is facing right now.
- You have no centralized view into your team’s performance.
- You have no accurate or efficient way to track progress or regressions over time.
- You have no real link between training and business risk reduction.
- And most importantly, you have no proof of ROI.
We built the Readiness Dashboard to give you a solution to every one of those challenges.
The Cyberbit Readiness Dashboard brings clarity to chaos by surfacing the key metrics that matter most when assessing cyber readiness. Each metric is rooted in real-world performance during live-fire cyber exercises.
Let’s go through the Readiness Dashboard metrics and their real-life impact for you as a security leader, for your team, and for your organization.
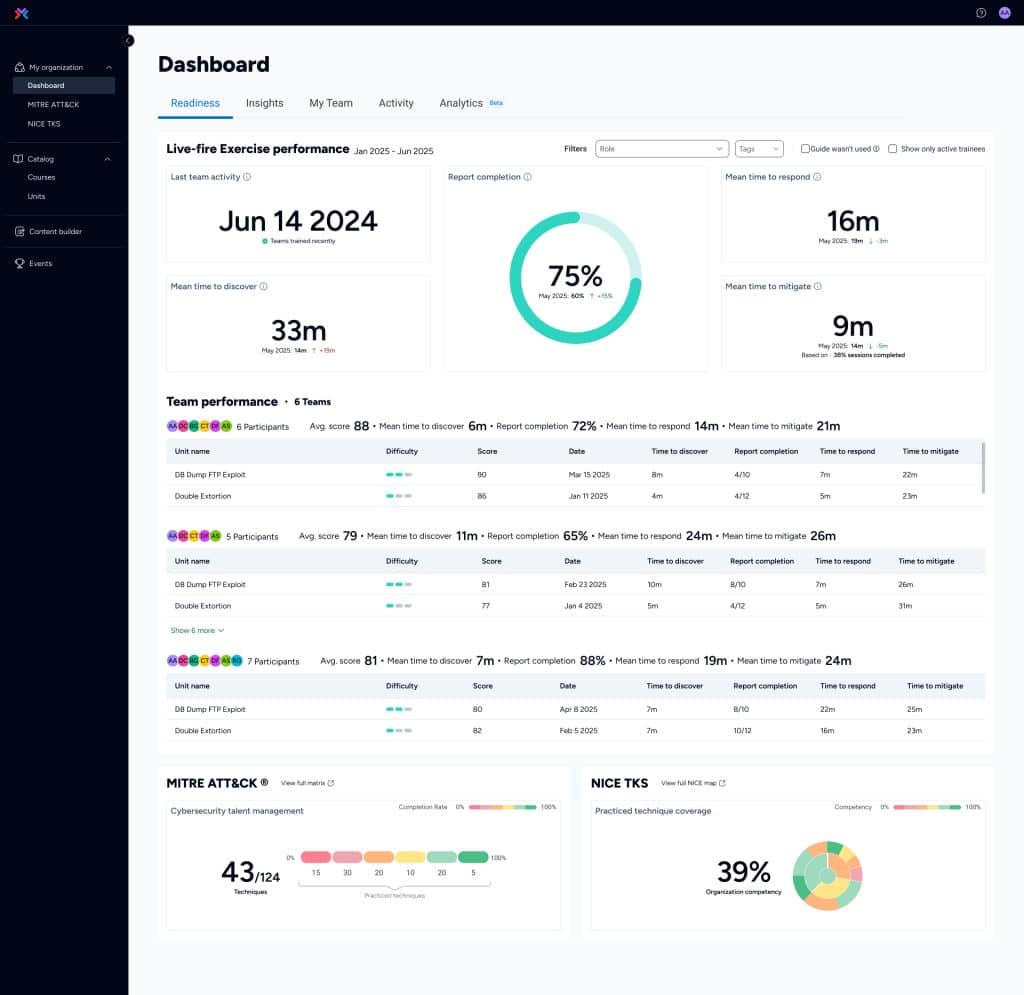
Mean Time to Discover (MTTD)
MTTD represents the average time it takes your team to identify a threat after it enters your environment.
Early detection is the first line of defense. The sooner a threat is detected, the smaller the window for damage. MTTD highlights your team’s alertness, tool effectiveness, and ability to recognize suspicious activity before it escalates.
Use it to:
- Benchmark your detection capabilities over time
- Identify lag in alert triage or missed signals
- Drive improvements in threat intel applications and visibility tools
Mean Time to Respond (MTTR)
MTTR is the average time it takes your team to take decisive action after detecting a threat.
Detection is only the beginning. MTTR shows how fast your team shifts from awareness to action, whether that’s containment, escalation, or initiating mitigation protocols. It’s a key measure of agility, coordination, and decision-making under pressure.
Use it to:
- Evaluate team responsiveness and communication efficiency
- Measure the real impact of playbooks and SOPs
- Identify where delays are happening post-detection
Mean Time to Mitigate (MTTM)
MTTM is the average time it takes your team to fully neutralize a threat once it’s been identified.
This is what it all comes down to. MTTM shows how long a threat remains active and dangerous inside your network. A low MTTM reflects strong execution of containment, eradication, and recovery processes.
Use it to:
- Assess overall response strength, not just speed
- Uncover bottlenecks in remediation workflows
- Demonstrate your team’s ability to stop threats before damage spreads
Report completion rate
This rate represents the percentage of exercises in which teams complete post-incident reporting and analysis.
It’s not just about stopping the threat, it’s about understanding it. This metric reveals whether teams are thoroughly documenting incidents, which is vital for compliance, root cause analysis, and continuous improvement.
Use it to:
- Track operational discipline and follow-through
- Support audit readiness and regulatory requirements
- Reinforce the importance of post-mortems and knowledge sharing
Recent activity
This shows how recently your teams and individuals have engaged in training exercises.
Cyber readiness isn’t static. In fact, it fades over time. This metric helps you spot disengaged users, identify inconsistent training habits, and maintain a culture of ongoing preparedness.
Use it to:
- Ensure training frequency meets organizational standards
- Flag gaps in engagement that could become performance risks
- Reinforce accountability at the team and individual levels
Role and team-level drill downs
Here, you have the ability to filter and analyze performance by team, role, or individual user.
This drill-down capability helps you pinpoint where strengths lie and where coaching or additional training is needed, at a granular level.
Use it to:
- Deliver personalized coaching and upskilling
- Identify high performers and underperformers
- Optimize team composition for real-world scenarios
MITRE ATT&CK coverage heatmap
Because visualization is everything, here’s a visual map showing which MITRE ATT&CK techniques your teams have practiced in live-fire scenarios.
This helps you connect the dots between simulated practice and real-world threats. Coverage gaps may represent blind spots in your defense strategy.
Use it to:
- Align training with actual threat actor behavior
- Prioritize exercises based on adversary TTPs
- Demonstrate how your SOC’s knowledge maps to threat-informed defense
NICE TKS coverage heatmap
And because we love heatmaps (who doesn’t?!), here’s one more! The NICE TKS heatmap shows competency coverage across NICE cybersecurity roles and knowledge areas.
This lets you visualize your organization’s overall skill coverage and spot where strategic upskilling is needed. It’s ideal for workforce development and compliance with national frameworks.
Use it to:
- Guide individual development plans
- Align team capabilities to workforce planning goals
- Support federal or industry training compliance
Trend analysis over time
Snapshots are useful, but trends tell the story. This rolling, 6-month view of how readiness metrics are evolving helps you track real progress (or regressions) over time, showing whether your investments in training are paying off.
Use it to:
- Prove ROI to executives and boards
- Identify seasonality or the impact of team changes
- Validate the effectiveness of specific training initiatives
Measuring readiness means enabling business
We didn’t build the new Readiness Dashboard just to have a cool new feature to show the world. Well, it is cool, and we do want to show the world, but our main goal is for this dashboard to become an essential business-enabling tool for every security leader.
Prove ROI: Show how training efforts are translating into better, faster, and more complete responses.
Access executive-ready reporting: No more vague summaries. Deliver hard data to your board and leadership.
Effectively target improvement: Spot who’s improving, stagnating, or falling behind, and act accordingly.
Close gaps before they become critical: Identify and fix issues before a real attacker exploits them.
Drive a culture of operational excellence: When readiness is visible and measurable, performance improves.
Does that sound like something your organization needs? Reach out and let us show you how real readiness is measured.